
Failure Analysis Report
The failure of the parts was due to Electrical Over-Stress
Figure 1: Curve tracing of pin 1 of the returned unit #1 as compared with a good unit.
The red curve is the curve of a good unit. And the white line is the curve of the returned unit.
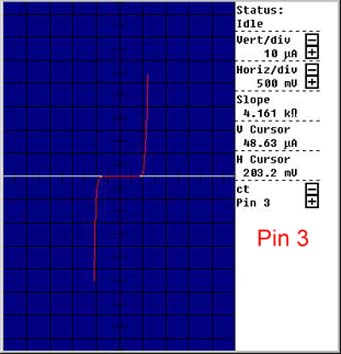
Figure 2: Curve tracing of pin 3 of the returned unit #1 as compared with a good unit.
The red curve is the curve of a good unit. And the white line is the curve of the returned unit.
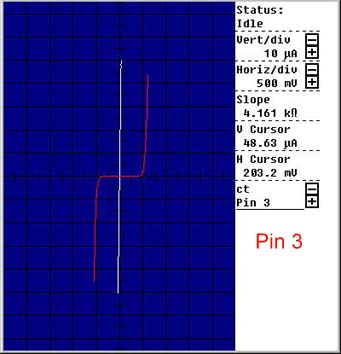
Figure 3: Curve tracing of pin 3 of the returned unit #3 as compared with a good unit.
The red curve is the curve of a good unit. And the white line is the curve of the returned unit.
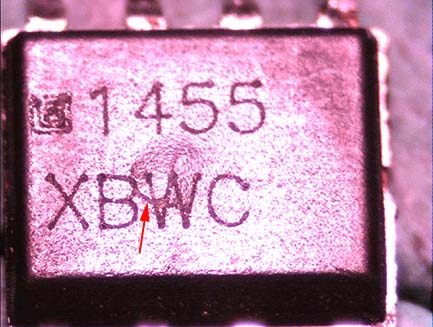
Figure 4: optical overview photo of the package of unit #1. The arrow indicates the bursting crack.
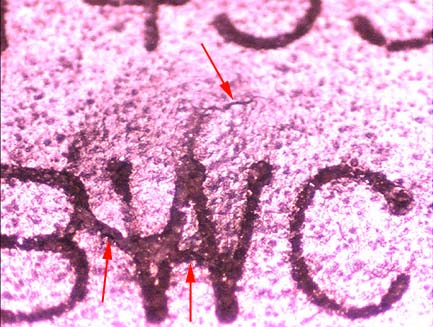
Figure 5: optical close-up of the package of unit #1. The arrows denote the bursting crack.
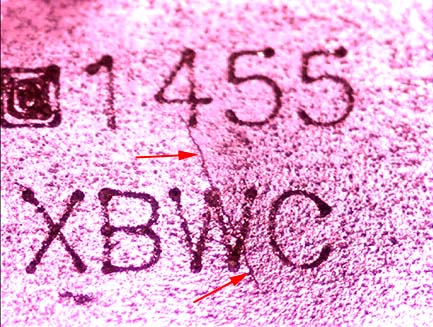
Figure 6: optical close-up of the package of unit #2. The arrows denote the bursting crack.
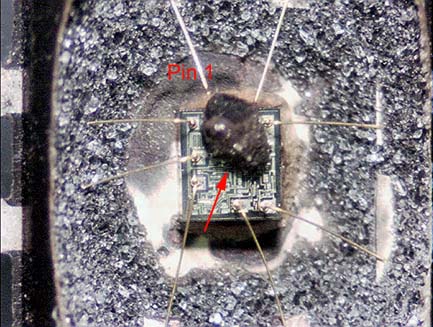
Figure 7: optical photo taken on unit 1 after decapsulation. The arrow indicates a chunk of fused mold compound.
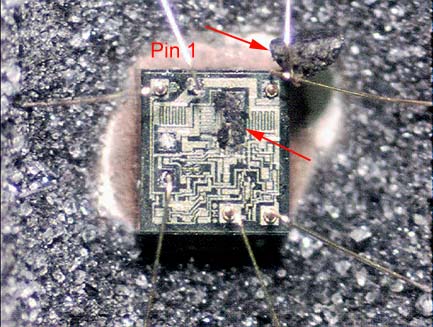
Figure 8: optical photo taken on unit 2 after decapsulation. The arrows indicate the fused mold compound.
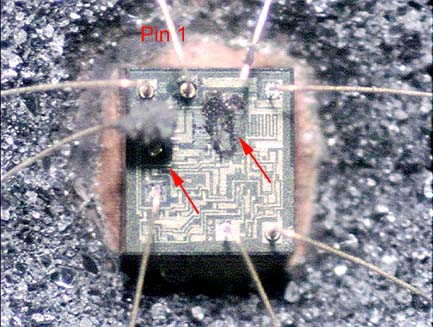
Figure 9: optical photo taken on unit 3 after decapsulation. The arrows indicate the fused mold compound.
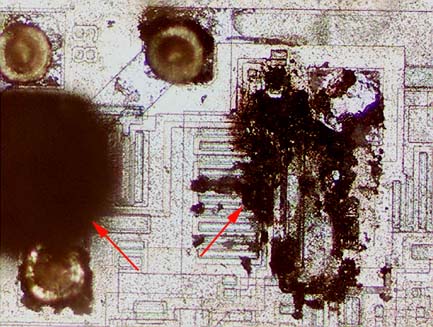
Figure 10: high-power optical photo taken on unit 3. The arrows indicate the fused mold compound.